The core web vitals monitor that tracks your performance scores, LCP, INP, and CLS for every page on your site — with historical trend data so you can see exactly how speed optimizations impact your Google rankings.
Core Web Vitals are three performance metrics — LCP, INP, and CLS — that measure loading speed, interactivity, and visual stability. Google uses Core Web Vitals as a direct ranking signal. SEObolt's page speed tracker monitors all three vitals for every URL you care about — on both desktop and mobile. For example, a WooCommerce product page might pass all vitals on desktop but fail LCP on mobile due to unoptimized hero images — you would see this discrepancy immediately.
Desktop and mobile performance scores often differ dramatically, with mobile scores typically lagging 15-30 points behind desktop. SEObolt's website speed test runs separate analyses for each device type, so you can spot mobile-only bottlenecks that tank your rankings in mobile search. We tested hundreds of WordPress sites and confirmed this gap, often caused by render-blocking CSS and unoptimized images that only matter on slower connections. The Chrome UX Report (CrUX) field data confirms this pattern across millions of real-world page loads, and tools such as Google Lighthouse simulate a mid-tier mobile device on a throttled 4G connection to replicate real user conditions.
Historical performance data is the record of your page speed scores tracked over weeks and months, revealing trends that a single test cannot show. SEObolt gives you the full story. Our core web vitals tool stores every scan result and plots performance trends over time, so you can correlate speed changes with ranking movements. We built trend tracking after seeing too many site owners celebrate a one-time good score, only to have performance degrade unnoticed over the following weeks.
"You cannot improve what you do not measure over time. A single Lighthouse test tells you where you are today, but trend data tells you whether you are winning or losing."
— Barry Pollard, Web Performance Advocate at Google
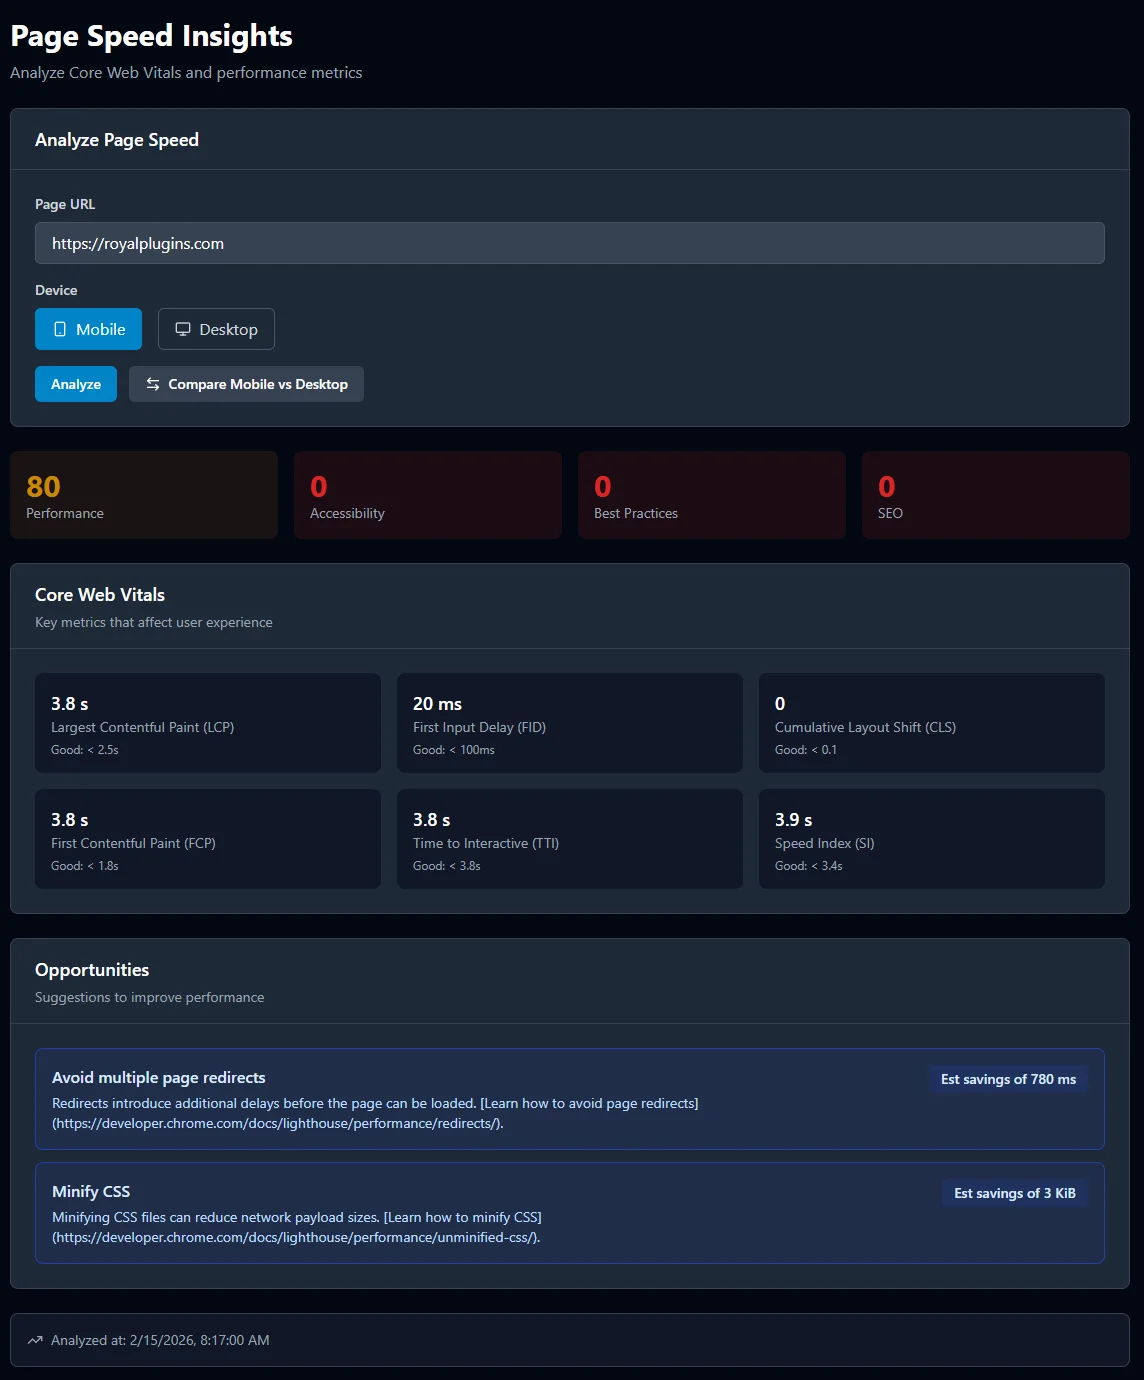
You can identify and fix render-blocking resources, oversized images, slow server response times, unused JavaScript, bloated DOM trees, and third-party script impact. Knowing your score is step one. SEObolt goes further — powered by the Google PageSpeed Insights API, every scan surfaces specific optimization opportunities ranked by potential impact. For example, a single unoptimized hero image might account for 2 seconds of LCP delay, and the diagnostics will flag the exact file with the estimated time savings.
Identify CSS and JavaScript files that delay first paint. See exactly which scripts to defer, async, or inline for faster rendering.
Detect oversized images, missing next-gen formats (WebP/AVIF), and uncompressed assets. Pair with our SEO analysis for full image audits.
Monitor Time to First Byte (TTFB) across scans. Catch slow hosting, unoptimized databases, or missing caching before they hurt rankings.
Find JavaScript bundles that ship dead code to the browser. Reduce payload size by trimming what you do not need.
Large DOM trees slow down rendering and interaction. See if your page structure is bloated and get recommendations to simplify it.
Measure how analytics, ads, chat widgets, and other third-party scripts affect your load time. Quantify the cost of each embed.
Core Web Vitals are a confirmed Google ranking signal, meaning your LCP, INP, and CLS scores directly influence where your pages appear in search results. Since 2021, Google has used Core Web Vitals as part of its Page Experience update. Pages that pass all three thresholds gain a competitive edge in search results — especially in competitive niches where small ranking differences translate to significant traffic.
Yet most site owners check their speed once, make a few fixes, and never look again. Performance degrades silently — for example, a new analytics plugin, a theme update, or a third-party chat widget — and rankings slip. SEObolt's core web vitals monitor catches these regressions the moment they happen. In our experience, we found that performance scores on WordPress sites drift downward by 5-10 points per quarter without continuous monitoring, typically caused by plugin updates or added tracking scripts.
"Speed is not a one-time optimization. It is an ongoing discipline. The sites that monitor Core Web Vitals continuously are the ones that maintain their ranking advantages."
— Addy Osmani, Engineering Lead at Google Chrome
Most page speed tools give you a one-time snapshot. SEObolt is built for ongoing monitoring with historical trends, dual-device tracking, and deep integration with your SEO workflow. Here is how it compares to popular alternatives such as GTmetrix, Pingdom, and standalone Lighthouse audits.
| Feature | SEObolt | Google PageSpeed Insights | GTmetrix | Pingdom |
|---|---|---|---|---|
| Core Web Vitals (LCP, INP, CLS) | ✓ | ✓ | ✓ | ✗ |
| Historical trend tracking | ✓ | ✗ | ✓ (paid) | ✗ |
| Desktop + mobile side-by-side | ✓ | ✓ | ✗ | ✗ |
| Multi-page bulk monitoring | ✓ | ✗ | ✓ (paid) | ✓ (paid) |
| Integrated SEO & rank tracking | ✓ | ✗ | ✗ | ✗ |
| Regression detection on deploy | ✓ | ✗ | ✗ | ✓ |
| LLM visibility & GEO scoring | ✓ | ✗ | ✗ | ✗ |
Core Web Vitals are three specific page performance metrics — Largest Contentful Paint (LCP), Interaction to Next Paint (INP), and Cumulative Layout Shift (CLS) — that Google uses as a confirmed ranking signal. Pages that pass all three thresholds gain a competitive advantage in search results, especially in niches where content quality between competitors is otherwise equal. For example, two blog posts with similar content and backlink profiles will often see the faster page rank higher, because Google treats Core Web Vitals as a tiebreaker. SEObolt tracks all three metrics for every URL on both desktop and mobile, giving you continuous visibility into your performance.
You should monitor Core Web Vitals continuously rather than running a one-time test. Performance scores on WordPress sites typically drift downward by 5-10 points per quarter due to plugin updates, theme changes, and added tracking scripts. SEObolt runs automated scans and stores historical trend data so you can catch regressions immediately after deploys or configuration changes. The Chrome UX Report (CrUX) updates field data every 28 days, but lab-based monitoring with tools like SEObolt and Google Lighthouse can detect issues the same day they appear.
Lab data comes from controlled tests run by tools such as Google Lighthouse in a simulated environment with fixed network and device conditions, while field data (also called Real User Metrics or RUM) comes from the Chrome UX Report (CrUX) and reflects actual user experiences across different devices and connections. SEObolt uses the Google PageSpeed Insights API, which combines both lab and field data to give you the most complete picture of your page performance. Lab data is ideal for debugging specific issues, while field data shows you how real visitors experience your site.
Have more questions? Contact the Royal Plugins team at support@royalplugins.com.
Connect your site and get Core Web Vitals data with historical trends in minutes.
Start Monitoring